









Sri Lanka Got Its Tourists Back. The Spending Story Is More Complicated.
Tourist arrivals have recovered to almost the same level as 2018. But visitors are staying fewer nights, average earnings per arrival are lower, and a significant share of tourism activity is concentrated in a relatively small part of the country.
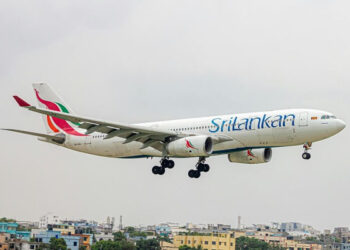
By the end of 2025, Sri Lanka had something the tourism industry had been waiting for since the Easter attacks, the pandemic and the economic crisis: the arrival numbers were back.
The Sri Lanka Tourism Development Authority recorded 2,362,521 tourist arrivals in 2025. That was 15.1 percent more than the 2.05 million recorded in 2024, and slightly higher than the 2.33 million visitors Sri Lanka received in 2018.
On an arrivals chart, that looks like a recovery.
But arrivals are only the first number in the tourism story.
A visitor who spends ten nights in Sri Lanka is a very different economic proposition from one who spends six. The hotel bill, restaurant meals, transport, entrance fees, shopping and excursions accumulate with every additional day.
That is where the comparison with 2018 becomes interesting.
The missing nights
According to the Central Bank of Sri Lanka, the average tourist stayed about 10.8 nights in 2018. By 2025, that figure had fallen to about 8.3 nights.
SLTDA’s own 2025 review gives an average duration of 8.29 nights.
That is not a small change. It represents roughly 2.5 fewer nights per visitor than in 2018.
The 2025 figure is approximately 23 percent lower than the 2018 average.
Multiply that across more than two million arrivals and the difference becomes substantial. Sri Lanka can therefore reach almost the same number of visitors without recreating the same amount of tourism activity that existed seven years earlier.
The revenue gap is even harder to ignore
The Central Bank’s tourism figures show the same problem from another direction. Tourism earnings were about US$4.38 billion in 2018. In 2025, SLTDA reported tourism revenue of about US$3.22 billion.
Put simply, Sri Lanka had slightly more visitors in 2025 than it did in 2018, but considerably less tourism revenue.
Based on official tourism revenue/earnings figures. Methodological revisions and differences between publications should be considered when comparing years.
Calculated by dividing reported tourism earnings/revenue by tourist arrivals. This is a comparison calculation, not an official SLTDA indicator.
Not every tourist is arriving with the same itinerary
The length of a stay also depends heavily on why a person comes to Sri Lanka.
SLTDA’s 2025 data shows that visitors travelling for health and Ayurveda stayed the longest, at about 14.7 days. People visiting friends and relatives stayed around 11 days. Pleasure and vacation visitors averaged about 8.7 days.
At the shorter end were business travellers, at about 5.2 days, and visitors travelling for official purposes, at around 5.5 days.
The source market matters too. European visitors recorded a longer average stay than visitors from Asia. SLTDA puts the average at about 10.32 days for Europe, compared with 6.36 days for Asia.
India is now Sri Lanka’s largest individual source market. More than 531,000 Indian visitors arrived in 2025. But their average stay was only about five days.
That does not make the Indian market less valuable. Short-haul visitors can return more frequently, and India also brings business, MICE and visiting-friends-and-relatives traffic. But it does illustrate why simply counting arrivals can give an incomplete picture of tourism demand.
Where does the money actually go?
This is where the tourism numbers become more difficult to read.
The official assessment of tourism revenue and value retention commissioned through SLTDA found that tourist spending is spread across several parts of the economy.
In the assessment’s spending distribution, accommodation accounted for about 31.8 percent of tourist expenditure. Food and eating out represented about 30.7 percent, while transport, including local guides, accounted for roughly 21.9 percent.
This matters because the economic benefit of a tourist does not stop at the hotel reception desk.
A hotel buying imported food is different from a hotel buying vegetables from farmers nearby. A restaurant importing a branded product creates a different domestic economic effect from one sourcing the same requirement locally. An international booking platform may bring the customer to Sri Lanka while retaining a commission outside the country.
Estimated tourism-related expenditure associated with international supply chains, imported inputs, external intermediation and other forms of value leaving or bypassing parts of the domestic economy.
The SLTDA value-retention assessment estimated roughly US$1 billion in tourism-related expenditure associated with international supply chains, imported inputs, external intermediation and other forms of value leaving or bypassing parts of the domestic economy.
That figure needs to be handled carefully. The report does not say that Sri Lanka simply lost US$1 billion, nor does it describe the entire amount as money that could realistically be retained domestically. Foreign investment, international booking platforms and imported goods are part of normal tourism operations.
But the study does point to a less visible problem: the amount tourists spend is not the same as the amount of that spending that remains with Sri Lankan businesses, workers and suppliers.
The attraction figures tell a different story
There is another number that can easily be misunderstood: entrance revenue.
Sri Lanka’s major wildlife parks and heritage sites recorded millions of visits during 2025. Yala, for example, recorded more than 772,000 visitors, including more than 426,000 foreign visitors.
The recorded revenue from foreign visitors and vehicles at Yala amounted to roughly Rs. 2.76 billion.
| Attraction | Foreign visitors | Foreign income | Approx. income / foreign visitor |
|---|---|---|---|
| Yala | 426,535 | Rs. 2.66bn | ~Rs. 6,244 |
| Udawalawe | 197,981 | Rs. 1.45bn | ~Rs. 7,307 |
| Horton Plains | 51,770 | Rs. 376.6m | ~Rs. 7,274 |
| Wilpattu | 76,389 | Rs. 412.9m | ~Rs. 5,405 |
| Pigeon Island | 20,585 | Rs. 148.9m | ~Rs. 7,233 |
| Mirissa | 107,324 | Rs. 235.0m | ~Rs. 2,190 |
Udawalawe recorded almost 369,000 visitors, including nearly 198,000 foreigners, while Horton Plains recorded more than 387,000 visitors.
The Cultural Triangle sites produced another large stream of direct entrance revenue. Across the Central Cultural Fund’s sites, foreign visitors numbered almost 957,000 in 2025 and foreign visitor income was about Rs. 5.4 billion.
Sigiriya alone recorded more than 504,000 foreign visitors and generated about Rs. 3.68 billion in foreign visitor income.
These figures are useful, but they should not be mistaken for what tourists spent at the destination. A visitor who pays an entrance fee at Sigiriya may also have paid for a hotel in Dambulla, a driver, meals, fuel, a guide and shopping. Those transactions are outside the entrance-fee figure.
And the tourism map remains uneven
The distribution of accommodation helps explain why some parts of Sri Lanka see much more tourism activity than others.
SLTDA recorded 59,578 registered rooms across the country in 2025, spread across 4,927 registered accommodation establishments.
Colombo alone had more than 11,000 registered rooms, while Galle had more than 10,000. Kandy followed with about 4,657 and Gampaha with around 4,865.
By comparison, several districts in the north and east have much smaller formal accommodation bases. Jaffna had fewer than 800 registered rooms in the 2025 figures. Trincomalee had fewer than 900.
This does not mean tourists are not travelling to those areas. It means the ability to accommodate, organise and monetise larger numbers of visitors is still concentrated elsewhere.
The recovery has also become less straightforward in 2026
The first months of 2026 provide another reason not to assume that the 2025 recovery will simply continue upward.
SLTDA recorded 1,535,122 arrivals between January and August 2026. January and February were stronger than the same months a year earlier, but March and April saw sharp declines. June was also down almost 10 percent year on year, while July and August remained slightly below 2025 levels.
| Month | Arrivals | Year-on-year |
|---|---|---|
| January | 277,327 | +9.7% |
| February | 279,328 | +16.2% |
| March | 183,979 | -19.8% |
| April | 135,643 | -22.3% |
| May | 145,745 | +9.6% |
| June | 124,551 | -9.9% |
| July | 196,845 | -1.7% |
| August | 191,704 | -3.3% |
The Central Bank reported that tourism earnings during the first half of 2026 were estimated at US$1.511 billion, down 11.8 percent from the corresponding period of 2025.
The April numbers were particularly weak: arrivals fell 22.3 percent year on year and estimated tourism earnings fell 38.8 percent.
Estimated tourism earnings, down 11.8 percent from the first half of 2025.
A longer stay may matter more than another million arrivals
There is no single policy that will solve this.
Better air connectivity can bring more visitors. Marketing can bring more visitors. New hotels can accommodate more visitors. But none of those automatically means a visitor will stay an extra night or spend more money with Sri Lankan businesses.
The data suggests that Sri Lanka has a different opportunity now. The country already has a large tourism base, a recognised wildlife product, beaches, heritage sites, wellness tourism and a substantial network of accommodation.
The harder task is connecting those pieces.
A tourist who spends five days in Sri Lanka and a tourist who spends ten days are both counted as one arrival. The arrival statistics treat them equally. The economy does not.
That is why the next phase of Sri Lanka’s tourism recovery should probably be measured by more than the number displayed on the monthly arrivals report.
The more revealing figures are the nights spent here, where those nights are spent, what visitors buy during them, how much of that spending reaches local suppliers and workers, and how much economic activity is created outside the country’s established tourism centres.
Sri Lanka has already shown that it can bring the tourists back.
The bigger challenge is getting more value from the time they spend here.
More from Lakbima News
The US$1 Billion Question: How Did So Much Money Leave Sri Lanka?
The Customs Gap: How Much Money Is Sri Lanka Leaving Behind?
Yala Water Crisis: Sri Lanka’s Wildlife Faces Severe Drought Pressure
Sources: Sri Lanka Tourism Development Authority, Central Bank of Sri Lanka and Department of Census and Statistics.
Tourism revenue, average-stay and value-retention figures can differ between publications because of revisions and methodology. Direct attraction income figures should not be interpreted as total tourist expenditure. Calculated figures in this article are identified as calculations rather than official indicators.